Monitoring Kafka on Kubernetes with Prometheus
This is the second blog is our series of “Running Kafka on Kubernetes” — for context and initial setup, readers are encouraged the read the first entry to be able to setup Apache Kafka on Azure Kubernetes Service with enabled end-to-end encryption.
“Everything fails, all the time !” — Werner Vogels, Amazon CTO
While the probability of failure has decreased, but what Werner said in 2008 still holds true to a great extent, no matter whether you run your application in a on-prem environment or use any public cloud, the virtual machine running your software will eventually fail. And this is why having proper monitoring and alerting mechanisms in place is of quintessential importance. And this is why we see industries adopting concepts like Infrastructure as Code (IAC) & Immutable Infrastructure and are increasingly investing in building SRE and/or DevOps culture in their teams.
Let’s get Started !
In this blog post, we explore how we can use Prometheus & Grafana for monitoring and alerting requirements and configure the Kafka Cluster to expose not only pod level metrics ( Memory, CPU, Available Disk Space, JVM GC Time and Memory Used, Network metrics etc) but also more Kafka contextual metrics like Consumer Lag, Messages produced and consumed per second, Number of Replicas per Topic/Partition, Number of In-Sync Replicas per Topic/Partition etc.

Prometheus
Prometheus joined CNCF in 2016 and become the second hosted project (second only to Kuberenetes) — this should be enough to convince you on the active community behind the project and the fact that it could be considered as a standard for monitoring & alerting. It offers a multi-dimensional data model with time series data identified by metric name and key/value pairs and a flexible query language (PromQL) to select and aggregate tune series data in real time. Some important notes about Prometheus before we proceed with the setup:
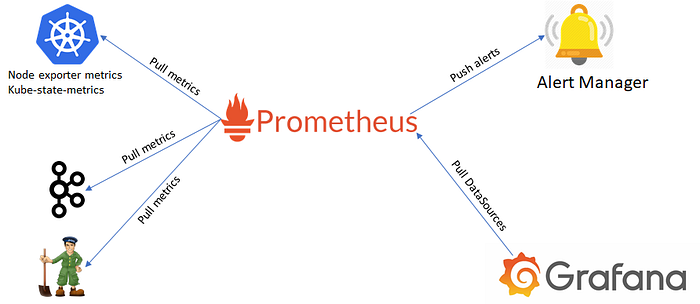
- Prometheus does not require you to install any agents onto your services/jobs which you want to be monitored, rather it works on a pull-based model — where you expose metrics from your service and it will pull those metrics at a configurable interval.
- You can configure Alerting rules/expressions in Prometheus which when evaluate to true, will result in an alert being pushed to another component known as Alert Manager. Alert Manager can then be configured with various notification channels like Pager Duty, Email, Slack channels etc. to send out these alert notifications to the concerned DevOps/SRE teams.
- Prometheus does provides a basic Web UI for visualizing these metrics but again the community has mostly converged to use Grafana for visualization requirements.
- Kubernetes provides an add-on agent: kube-state-metrics which listens to Kuberenetes API Server and generates and exposes cluster-level metrics about the health of various objects like Deployments, Pods, Nodes etc.
kube-state-metricsalso exposes a Prometheus compatible endpoint which can easily be configured for consumption. - Prometheus also provides another exporter for hardware and OS level metrics, exposed by *NIX kernels: Node Exporter — you can deploy this as a
DaemonSeton your cluster (one node exporter per node) and then expose the metrics using aServiceto expose the metrics which will be automatically scrapped by Prometheus if you use the annotationprometheus.io/scrape:'true'— An example for the same can be downloaded from here and applied to your cluster usingkubectlAnother way to install the same is using a Helm chart

Set it up !
Now that we have a basic understanding of what we want to achieve, let’s start with installing Prometheus & Grafana on our Kubernetes cluster. As always there are multiple options but we will stick with our friendly-neighborhood-operators to help us out with it. Let’s first create the namespace for our monitoring setup
kubectl create namespace monitoringStep 1: Install the Prometheus Operator
kube-prometheus provides a quick way to deploy Prometheus operator, Prometheus server, Grafana, Highly available Alert Manager, Node Exporter, kube-state-metrics and other helpful tools. I personally feel like losing control when deploying everything under manifests for kube-prometheus so we will take a different way to deploy these components, but your mileage may vary so feel free to deploy everything using kube-prometheus. However if you want to deploy using kube-prometheus on AKS, you must label your nodes correctly. The deployment configuration of some of these manifests include the nodeSelector as
nodeSelector:
    kubernetes.io/os: linux
This will not work by default with your AKS Cluster, so you must label your nodes accordingly using kubectl
kubectl label nodes <node-name> kubernetes.io/os=linuxWhat we’ll do instead for our example is to take things slowly and deploy things one-at-a-time, starting with Prometheus Operator: The Prometheus Operator requires certain Kubernetes RBAC related resources like ServiceAccount , ClusterRole and ClusterRoleBinding in order to be able to authenticate against the API server and watch the custom resources for Prometheus — all the code for this blog post can be found on Github so please clone the repository and follow along
Clone the repo from Github to follow along.
So let’s start by creating ServiceAccount, ClusterRole & ClusterRoleBinding for our Operator in the monitoring namespace
kubectl apply -f monitoring/prometheus-setup/prometheus-operator-service-account.yaml -n monitoring
kubectl apply -f monitoring/prometheus-setup/prometheus-operator-cluster-role.yaml -n monitoring
kubectl apply -f monitoring/prometheus-setup/prometheus-operator-cluster-role-binding.yaml -n monitoring
kubectl apply -f monitoring/prometheus-setup/prometheus-operator-deployment.yaml -n monitoring
Step 2: Create a Service Monitor
Before we go further with deploying Prometheus server, we need to configure Recording & Alerting rules; let’s must take a step back and understand a bit more about how the operator works, what are the custom resources it exposes, how they interact with each other etc.

Service Monitors are one of the Custom Resources offered by the Prometheus Operator and basically provides a way to tell the operator to target new Kubernetes Services for scraping by Prometheus. A ServiceMonitor should be deployed in the same namespace where Prometheus is deployed, although it could target services deployed in other namespaces also using namespaceSelector property. Here is the truncated version of the Service Monitor yaml used to scrape Kafka related metrics from the earlier deployed Kafka Cluster
Couple of things to note here:
spec.selector.matchLabelsis used to target the service by matching labels.spec.selector.namespaceSelector.matchNamesis used to select the namespace in which the service is running.
kubectl apply -f monitoring/strimzi-service-monitor.yaml -n monitoringStep 3: Setup some Prometheus Rules
Another Custom Resource PrometheusRule can be used to configure alert rules in Prometheus. Here is how one looks
kubectl apply -f prometheus-rules.yaml -n monitoringStep 4: Edit the Kafka Cluster
Now is the time to edit the existing Kafka cluster ( we created in the earlier blog post ) and add the following items:
Step 4 a) Add Metrics for Kafka Brokers & Zookeepers
Above is a snippet of how metrics are added to Kafka Brokers and Zookeeper. Prometheus offers four core metric types — Counter, Gauge, Histogram and Summary
Step 4 b) Kafka Exporter
While Prometheus has a JMX exporter that is configured to scrape and expose mBeans of a JMX target, Kafka Exporter is an open source project used to enhance monitoring of Apache Kafka brokers and clients by extracting additional metrics data from Kafka brokers related to offsets, consumer groups, consumer lag, and topics. Some useful examples of alerts that can be created based on these metrics are:
- Under Replicated Partitions of a Topic
- ConsumerGroup Lag is too large = Very Slow Consumers, falling behind producers
- An alert can be created if there is no message on a topic for a configurable amount of time
Add the following snippet after spec.zookeeper to tls-kafka.yaml
Time to update our existing Kafka Cluster:
kubectl apply -f monitoring/tls-kafka.yamlKafka Exporter enhances monitoring of Apache Kafka brokers and clients by extracting additional metrics data from Kafka brokers related to offsets, consumer groups, consumer lag, and topics.
Step 5: Create the Prometheus Server
Now that we have the Operator running, we will create the custom resource for Prometheus specifying some config and the Operator will spin up a Deployment to manage the Prometheus server instance.
The above gist only shows the important piece of the puzzle — the Prometheus Custom Resource. The complete code is present here.
Before we deploy this, it is recommended to add some additional scraping targets for cAdvisor, kubelet, pods & services. They can be added to the Prometheus resource using spec.additionalScrapeConfigs property. To do so, we need to create the following Kubernetes Secret
kubectl create secret generic additional-scrape-configs --from-file=prometheus-additional.yaml -n monitoringNow let’s deploy the Prometheus Server
kubectl apply -f monitoring/prometheus.yaml -n monitoringAnd that’s it. The operator does the rest — creates the Prometheus server instance and a couple of services and we can now simply do a port-forward and open up the basic Web UI offered by Prometheus
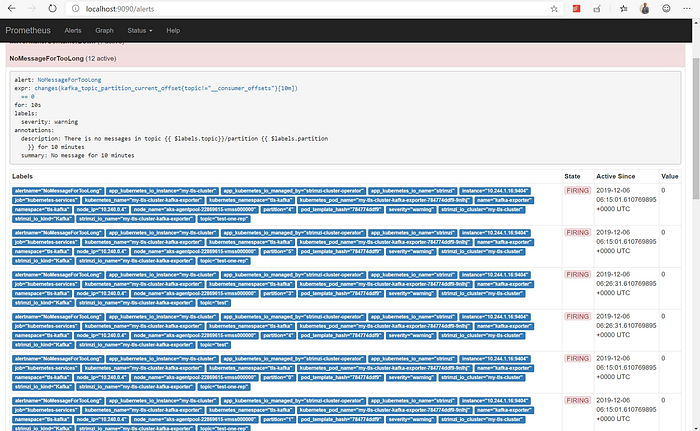
kubectl port-forward prometheus-prometheus-0 9090:9090 -n monitoringNow point your browser to http://localhost:9090 and you would see something similar to the below:

This UI can also be used to see configured Alerts, how many of them are active and and details about when they were fired.


We will see in subsequent sections on how to configure the Alert Manager to send out these alerts/notifications and how a much better visualization tool can be used to see these metrics in action !
Alert Manager
Alert Manager is responsible for passing on the generated alerts to the configured notification receivers. Examples of receivers could be chat clients like Microsoft Teams, Slack or on-call notification systems like OpsGenie or PagerDuty. It provides a way to integrate with your own notification/alerting systems via Webhooks as well.

So AlertManager is responsible for grouping related alerts, silencing and inhibiting alerts if related alerts already occurred, de-duplicating alerts and finally distributing to configured receivers. Following Prometheus Operator guidelines, to create and configure AlertManager, we need
AlertManagerCustom Resource specifying anameand the number of replicas needed for theStatefulSetit deploys- A Kuberenetes
Secretholding the configuration forAlertManager— the secret must be named asalertmanager-{name}wherenameis the name of the Custom Resource created in the first step. This secret is created from a YAML file specifying the configuration of the Alert Manager — which may include theroutes,receivers,inhibit_rules,templatesfor the alerts. - A Kubernetes
Servicewhich exposes theAlertManagerso that it can interact withPrometheusand receive alerts.
Since the AlertManager pod will not start up until the secret alertmanager-{name} is deployed so we start by creating the secret from our config file:
kubectl create secret generic alertmanager-alertmanager --from-file=monitoring/alertmanager-setup/alertmanager.yaml -n monitoringImportant to note that the config file for alertmanager must be named
alertmanager.yaml— nothing else would work. The secretalertmanager-{name}must be created from a config file namedalertmanager.yaml
Next, we create the Custom Resource for AlertManager
kubectl apply -f monitoring/alertmanager-setup/alert-manager.yamlThat’s it — no need to connect Prometheus with AlertManager. The Operator will take care of doing that for you. See following as an example of a very raw alert being posted to the configured slack channel. Of course, you have the option to specify a template and custom image to format the message body.

Grafana
Grafana is an open-source visualization framework that could be used to work with disparate data sources including Prometheus. Since Grafana is not really a part of Prometheus stack, so the prometheus operator does not offer a CRD to install or manage Grafana and its connections to Prometheus, rather you can simply install Grafana on AKS using a Deployment and a Service
Install this in your AKS cluster using
kubectl apply -f monitoring/grafana.yaml -n monitoringThis deploys the Grafana server and exposes it via a Service — you can access the GUI using port-forwarding
kubectl port-forward grafana-85d856cf58-s5m4g 3000:3000 -n monitoringGo ahead and access the Grafana UI at http://localhost:3000 and login with default admin/admin credentials — change the admin password on first login and then configure Prometheus DataSource using the prometheus-operated Kubernetes Service we created along with Prometheus Custom Resource. See the list of services using kubectl

Select Add Data Source → Prometheus → enter the details as below

Import Dashboards
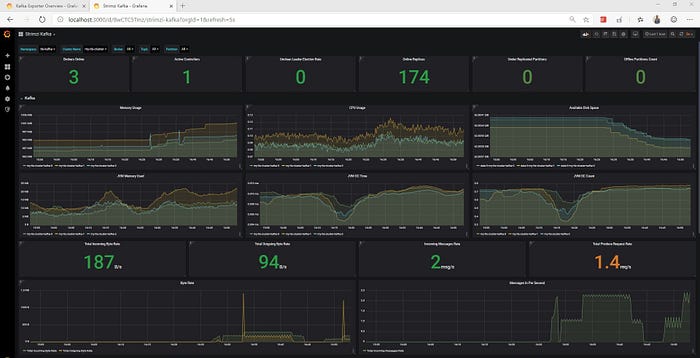
The awesome community at Strimzi provides us with certain quickstart/example dashboards for Grafana which can be used as a starting point to explore the metrics
- Strimzi-Kafka — Shows basic metrics for Kafka Brokers
- Strimzi-Zookeeper — Shows metrics related to Zookeeper pods
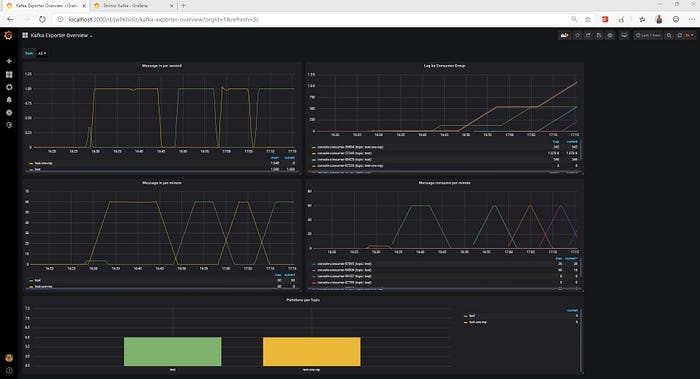
- Kafka-Exporter — Metrics exported using Kafka Exporter.
Import these dashboards in Grafana and start playing around.


Performance Testing
You can also run the Kafka Performance Test Tools kafka-producer-perf-test.sh and kafka-consumer-perf-test.sh —as an example to do so, exec into the configured kafka clients and execute
bin/kafka-producer-perf-test.sh --topic test-one-rep --num-records 50000000 --record-size 100 --throughput 1 --producer-props acks=1 bootstrap.servers=my-tls-cluster-kafka-bootstrap.tls-kafka:9093 buffer.memory=67108864 batch.size=8196 --producer.config /opt/kafka/config/ssl-config.propertiesHere are some benchmark commands that you might find helpful.
Conclusion
I hope this article helps you with setting up your monitoring environment using Prometheus and enable you to be more proactive in dealing with the infrastructure you work with.
References
- Kafka Exporter
- Kubernetes Monitoring with Prometheus Operator
- kube-prometheus: Deploy Prometheus Operator to Kubernetes with quickstart manifests for Prometheus, Grafana, Alert Manager, node-exporter, kube-state-metrics etc.
- DigitalOcean: Kuberenetes Cluster Monitoring with Helm & Prometheus Operator
- Add new scraping targets via ServiceMonitor
- Integrating Prometheus AlertManager with Microsoft Teams
